Weather Charts
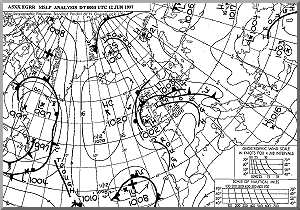
 Surface pressure chart - Met. Office: Bracknell
Weather charts provide a visual way to display the huge quantity of observations and other data that is collected across the globe each and every day. Once collected, manually or automatically, the observation data is coded and transmitted using internationally agreed numerical codes - as in the example shown:
SIHE20 EGRR 122100 AAXX 12214 61901 46/// /1111 10169 20168 40195 5////= |

Weather (Synoptic) Charts
 | Current weather - pressure charts
Shows HIGH and LOW pressure regions, frontal systems, isobars etc. | |
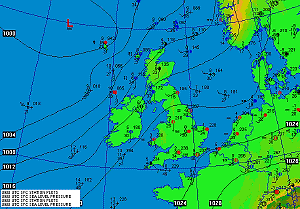
 | Current weather - plotted reports from observing stations
Daily reports from weather stations - wind, cloud, temperature, current weather etc. | |
 | Future weather - pressure chart predictions
Computed forecast charts for the weather over the next few days | |
| Links to a wide range of charted data can be accessed from Roger Brugge's listings at Reading University: | British Isles - plotted station data and charts Europe - plotted station data and charts |
|
Do it yourself! |
|
 |
Plot your own charts. Synoptic and other station data is readily available on the internet and can be downloaded for you to plot your own weather charts. The data is transmitted in a standard coded format - but this can be easily imported into display software to create your own maps using the latest data. | With access to station reports, weather satellite images etc., you have access to almost the same resources as the professional meteorologists. Can you make a better forecast? |
|
Display software
Download a copy of the Digital Atmosphere application - this is a large file (6.5Mb) but is also available in smaller sections. Software is available for free 30 day trial - download the manual as well!
Synoptic and other weather data files There are a number of sites that can deliver world wide station data for import into Digital Atmosphere.
|
|


 Back to main Weather
home page
Page update: January 12th 1999
This version: © St Vincent College