
September 21st 1989 - tracking towards the coast of Carolina, USA
Visible light image from GOES-E satellite
|
| Hurricane Hugo September 21st 1989 - tracking towards the coast of Carolina, USA Visible light image from GOES-E satellite |
Hurricanes (Atlantic tropical cyclones) normally form in mid-Atlantic from mid-summer (June/July) to late autumn (October) when sea temperatures are high (minimum temperature required is 26°C) and the inter tropical convergence zone is at its northernmost extremity. Converging air masses create massive convectional cells, drawing warm moist air from the sea surface. If the upper air conditions match those below, then it is possible for these convectional systems to develop into full hurricanes. The atmospheric disturbance drifts westwards as the Earth rotates beneath it - and is flung northwards by the coriolis effect.
If the moving system continues to gain latent heat energy through the condensation of water vapour to clouds, then wind speeds and rotational motion increases. Not all tropical disturbances develop into full hurricanes but those that do can deliver the most powerful natural releases of energy.

| Meteosat observations of the Mid-Atlantic region
Strong convectional cells can be seen in this image for late June 1997. Rapidly rising air condenses to form clouds at high levels. The intense white suggests very high cloud, probably reaching to 10Km or more above sea level. Click the image to download the latest visible light image for this region - download images for a number of days and try to track the north westerly movement of cloud systems. |

| GOES-E observations of the Caribbean region
Hurricanes developing over the mid-Atlantic will track north west to the area shown in this GOES image. By the time they reach the Caribbean region, hurricanes are approaching maturity and the tight swirl of cloud around the eye may be visible (upper cloud sometimes hides the eye from satellite observations). When hurricanes occur, click this image at regular intervals to download the latest version so that you can keep your own track of its progress. |
Hurricanes produce extremes of wind and rain. There are a number of automatic weather observation buoys in the key areas surrounding Florida and the islands to the south east of the US coastline. These buoys and weather stations regularly transmit details of current weather - allowing ground and sea level observations to be made of the passage of a hurricane.

| US National Weather Service
Interactive Marine Observations:
Oceanweather Inc. |
 | Data for Hurricane Hugo
This graph shows plots of barometric pressure (blue line) and wind velocity (red line) for the centre of Hurricane Hugo in 1989. The data clearly shows the relationship between pressure and velocity. Note: This data is for the moving hurricane and shows the development of the system over a period of nearly 14 days. |
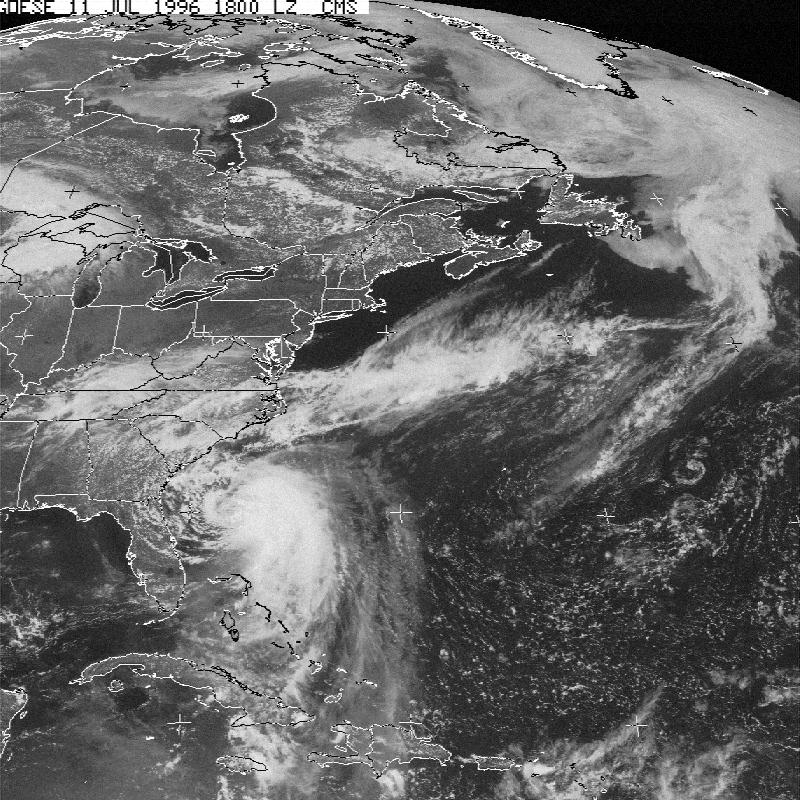
The US National Data Buoy service maintains archive records of buoy observations. A plot of the data for the passage of Hurricane Bertha (July 1996) can be found at the NDBC Education site. An image of Hurricane Bertha was taken by the GOES E satellite and shows the central eye heading for North Carolina on 11th July 1996.
Bertha was an early season hurricane and reached Category 2 - Bertha was responsible for 8 deaths and damage estimated at $250 million.
National Hurricane Center report on Hurricane Bertha
Page update: October 1999
